Most analysts do not have a reporting problem. They have an assembly problem.
The analysis itself, interpreting trends, identifying anomalies, drawing conclusions, takes a fraction of the total time. The rest goes to pulling data, formatting tables, writing the same introductory sentences, and distributing the output to the same list of people it went to last week. That cycle repeats every Monday, every month-end, every quarter.
This is not analytical work. It is operational overhead, and it compounds quietly over time.
The solution is not a faster way to do the same manual process. It is a system that runs the process without you.
This guide covers how to design that system: the architecture, the tools, the failure points, and the path from a single automated report to a recurring reporting infrastructure.
Why Recurring Reports Are the Right Place to Start
When analysts think about automation, they often reach for the most complex or visible problem first. A custom dashboard, a predictive model, a dynamic segmentation system. These are worthwhile projects, but they are not where automation compounds fastest.
Recurring reports are the better starting point for three reasons.
First, they are structurally consistent. The same data, the same format, the same recipients, the same schedule. That consistency is exactly what automation handles well.
Second, the manual cost is ongoing. A one-off analysis costs you time once. A weekly report that takes two hours to assemble costs you over 100 hours a year. Automating it returns that time permanently.
Third, the scope is contained. You are not building a new analytical system. You are replacing a manual assembly process with a scheduled one. The first version can be functional within a few hours.
This is where operational leverage actually starts: not with ambitious infrastructure, but with the work you are already doing every week.
The Anatomy of a Recurring Stakeholder Report
Before designing the automation, it helps to map the existing process precisely. Most recurring reports follow the same basic structure, even if the content varies.
Data extraction: pulling numbers from a source, whether that is a database, a spreadsheet, an API, or a BI tool export.
Formatting: arranging those numbers into a readable structure. Tables, summaries, period-over-period comparisons, commentary.
Distribution: getting the formatted output to the right people through the right channel. Email, Slack, a shared drive, a Notion page.
Confirmation: knowing the report was sent, when it was sent, and to whom. This is often skipped entirely, which creates problems when something breaks.
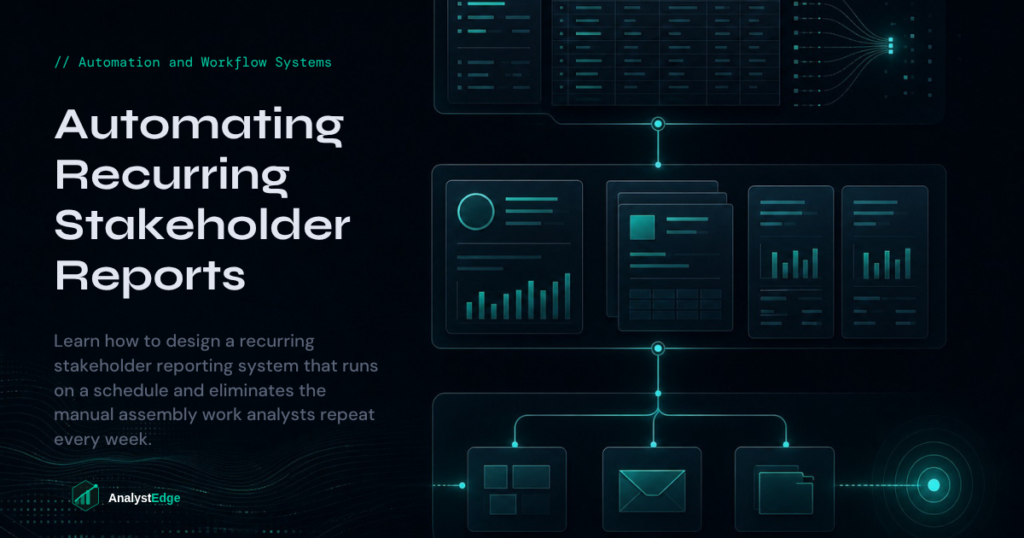
Each of these steps can be automated independently. The goal is to connect them into a single scheduled chain that runs without manual intervention.
Designing the Automation Architecture
A well-designed recurring report system has four distinct layers. Keeping them separate makes the system easier to maintain and easier to debug when something goes wrong.
The Data Extraction Layer
This is where the raw numbers come from. In most analyst environments, data lives in one of a few places: a SQL database, a Google Sheet, an API endpoint, or a BI platform export.
A Python script handles this layer cleanly. It connects to the source, runs the query or API call, and returns a structured dataset. The script does not need to be complex. It needs to be reliable and scheduled.
PythonAnywhere is a practical hosting option for this layer. It supports scheduled task execution without requiring a full server setup, and it handles the kind of lightweight data scripts that most recurring reports depend on.
The key discipline here is keeping the extraction logic separate from the formatting logic. One function pulls the data. Another function formats it. This separation makes both easier to update independently.
The Formatting and Template Layer
This layer takes the raw data and produces a readable output. The format depends on the audience and the delivery channel.
For email delivery, an HTML template with inline styles works reliably across clients. For Slack, a structured text block with clear sections is more appropriate. For document delivery, a Google Doc or PDF template populated programmatically gives you more control over layout.
Python handles all of these formats well. Libraries like jinja2 for HTML templating, python-docx for Word documents, and reportlab or fpdf for PDF generation cover most use cases.
The template itself should be designed once and reused. The data changes each cycle. The structure does not.
The Delivery and Routing Layer
This is where tools like Make and Zapier become useful. Once the formatted output exists as a file or a structured payload, a workflow automation tool can handle the routing.
A Make scenario, for example, can watch a Google Drive folder for a new file, then send it as an email attachment to a defined list, post a notification to a Slack channel, and update a Notion database entry, all from a single trigger.
Zapier handles similar routing with a slightly different interface and a broader library of native integrations. The choice between them depends mostly on the integrations your stack requires and your preference for how workflows are structured.
The important principle here is that delivery logic should live outside the Python script. The script produces the output. The automation tool distributes it. Mixing these responsibilities into a single script creates fragility.
The Logging and Confirmation Layer
This layer is skipped more often than it should be. When a scheduled report fails silently, nobody knows until a stakeholder asks why they did not receive it.
A simple logging system solves this. The Python script writes a row to a Google Sheet or a local log file each time it runs: timestamp, report name, status (success or error), and recipient count. Make or Zapier can send a brief confirmation to an internal Slack channel after each successful distribution.
This is not complex infrastructure. It is a basic operational discipline that makes the system observable and auditable.
Tool Stack for Recurring Report Automation
The tools below cover the majority of recurring report automation use cases without requiring significant infrastructure investment.
Python and PythonAnywhere
Python handles data extraction, transformation, and formatting. PythonAnywhere provides scheduled execution in a hosted environment that does not require managing a server.
For most recurring reports, a single Python script of 50 to 150 lines is sufficient. The script runs on a defined schedule, produces an output file or structured payload, and hands off to the delivery layer.
Make or Zapier
Both tools handle the routing and delivery layer well. Make offers more flexibility for multi-step workflows and is generally more cost-effective at higher automation volumes. Zapier has broader native integrations and a simpler interface for straightforward routing tasks.
For most analyst reporting workflows, either tool works. The decision usually comes down to which integrations are already in use in your environment.
Google Sheets as a Lightweight Data Layer
Google Sheets serves multiple roles in a recurring report system. It can be the data source, the output target, the log, or all three. The Sheets API is well-supported in Python, and Sheets integrates natively with both Make and Zapier.
For teams that do not have a formal data warehouse, Sheets is a practical foundation for lightweight recurring report automation.
Notion for Internal Distribution
Notion works well as an internal distribution target, particularly for teams that already use it as a knowledge base. A Python script or Make workflow can update a Notion page with the latest report data, creating a persistent record that stakeholders can access on demand rather than searching through email threads.
Building the First Version: A Practical Walkthrough
The first automated report should be the simplest one in your current rotation. Not the most important, not the most complex. The one that is most structurally consistent and least likely to require judgment calls during assembly.
Step 1: Map the existing process. Write down every manual step you currently take to produce the report. Data source, query or export method, formatting steps, distribution method. This map becomes the specification for the automation.
Step 2: Write the extraction script. Build a Python script that connects to the data source and returns the dataset you need. Run it manually several times to confirm it produces consistent output.
Step 3: Build the template. Create the output format once. HTML for email, a Google Doc template, a structured text block for Slack. Parameterize the data fields so the script can populate them programmatically.
Step 4: Connect the delivery layer. Set up a Make or Zapier workflow that picks up the output and routes it to the correct destination. Test it with a manual trigger before scheduling.
Step 5: Schedule the script. Set the PythonAnywhere scheduled task to run at the appropriate time. Confirm the schedule aligns with when stakeholders expect to receive the report.
Step 6: Add logging. Add a log write to the script and a confirmation message to the Make workflow. Run the full chain once in a test environment before activating the schedule.
The first version will not be perfect. It does not need to be. It needs to run reliably and produce output that is equivalent to what you were producing manually. Refinements come after the system is running.
Common Failure Points
A few issues appear consistently in recurring report automation systems. Knowing them in advance saves time.
Data source changes. If the underlying data structure changes, column names shift, or an API endpoint is updated, the extraction script will break. Build in basic validation: check that the expected columns exist and that the row count is within a reasonable range before proceeding.
Credential expiration. API keys, OAuth tokens, and service account credentials expire. Store credentials securely and set a calendar reminder to review them before they lapse. A broken credential is one of the most common causes of silent report failures.
Template drift. Stakeholders sometimes request format changes. If the template is hardcoded in the script, updates require code changes. Keeping the template in a separate file or Google Doc makes it easier to update without touching the logic.
Delivery failures. Email delivery can fail due to spam filters, attachment size limits, or recipient list changes. Slack webhooks can expire. Confirm that the delivery layer has error handling and that failures surface in the log.
Schedule conflicts. If the data source is refreshed on a schedule, confirm that the extraction script runs after the refresh is complete. A script that runs before the data is updated will distribute stale numbers.
Scaling from One Report to a Reporting Infrastructure
Once the first automated report is running reliably, the architecture is reusable. The extraction pattern, the template system, the delivery routing, the logging layer: these components apply to every subsequent report you automate.
The second report takes less time to build than the first. The third takes less time than the second. This is where the compounding value of reusable infrastructure becomes concrete.
A mature recurring report system might include five to ten automated reports running on different schedules, all using the same underlying architecture, all logging to the same master sheet, all routing through the same Make or Zapier account. Managing that system takes minutes per week, not hours.
At that point, the reports have become products. They run on a schedule, they are observable, and they do not depend on any individual analyst’s time to produce.
This is a meaningful shift in how analytical work operates. The analyst who built the system is no longer the person who assembles the report. They are the person who maintains the infrastructure and directs the analysis that the reports surface.
Reports as Products, Workflows as Assets
The framing that matters here is not efficiency. It is architecture.
A report you build manually every week is a task. A report that runs on a schedule, routes to the right people, logs its own delivery, and alerts you when something breaks is a product. The difference is not just time saved. It is a different relationship to the work.
Analysts who build recurring infrastructure are not just faster. They are operating at a different level. Their time goes toward interpretation, investigation, and system improvement rather than assembly.
The recurring stakeholder report is the right place to start building that way. The structure is clear, the value is immediate, and the architecture transfers directly to every other recurring process in the workflow.